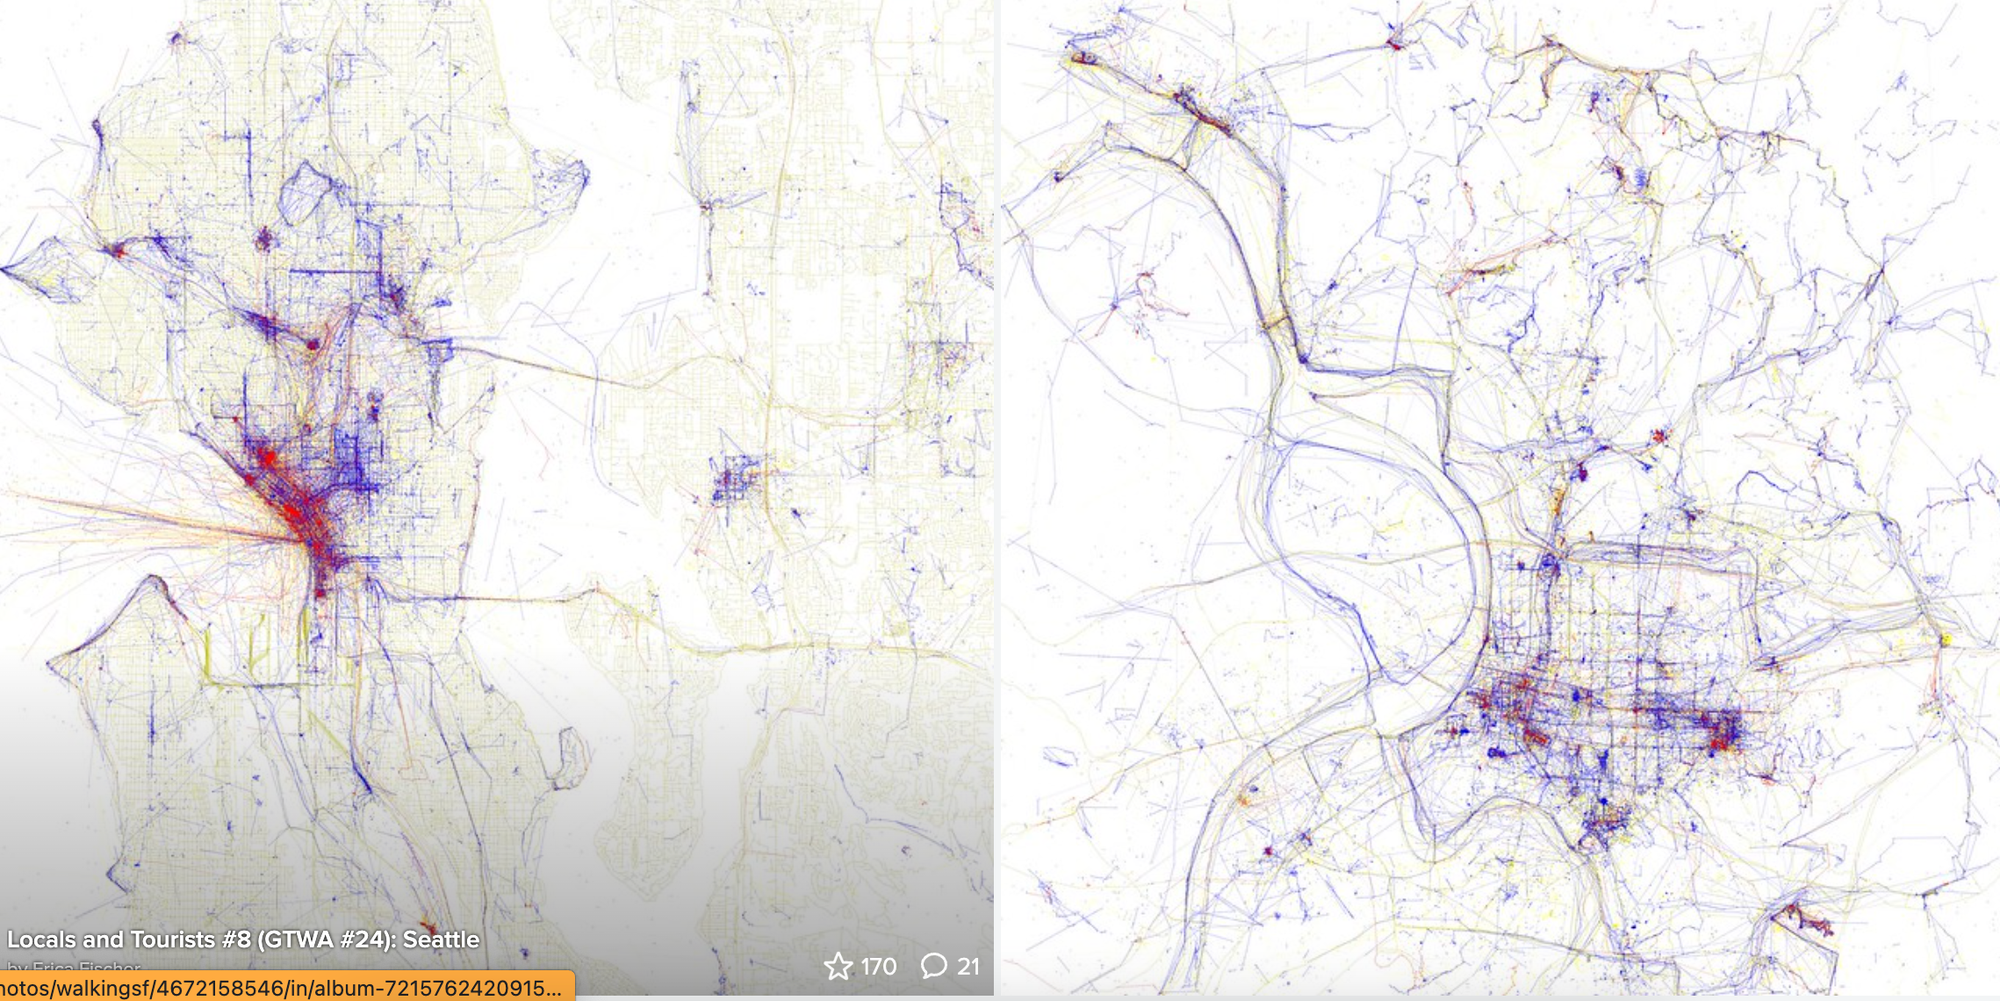
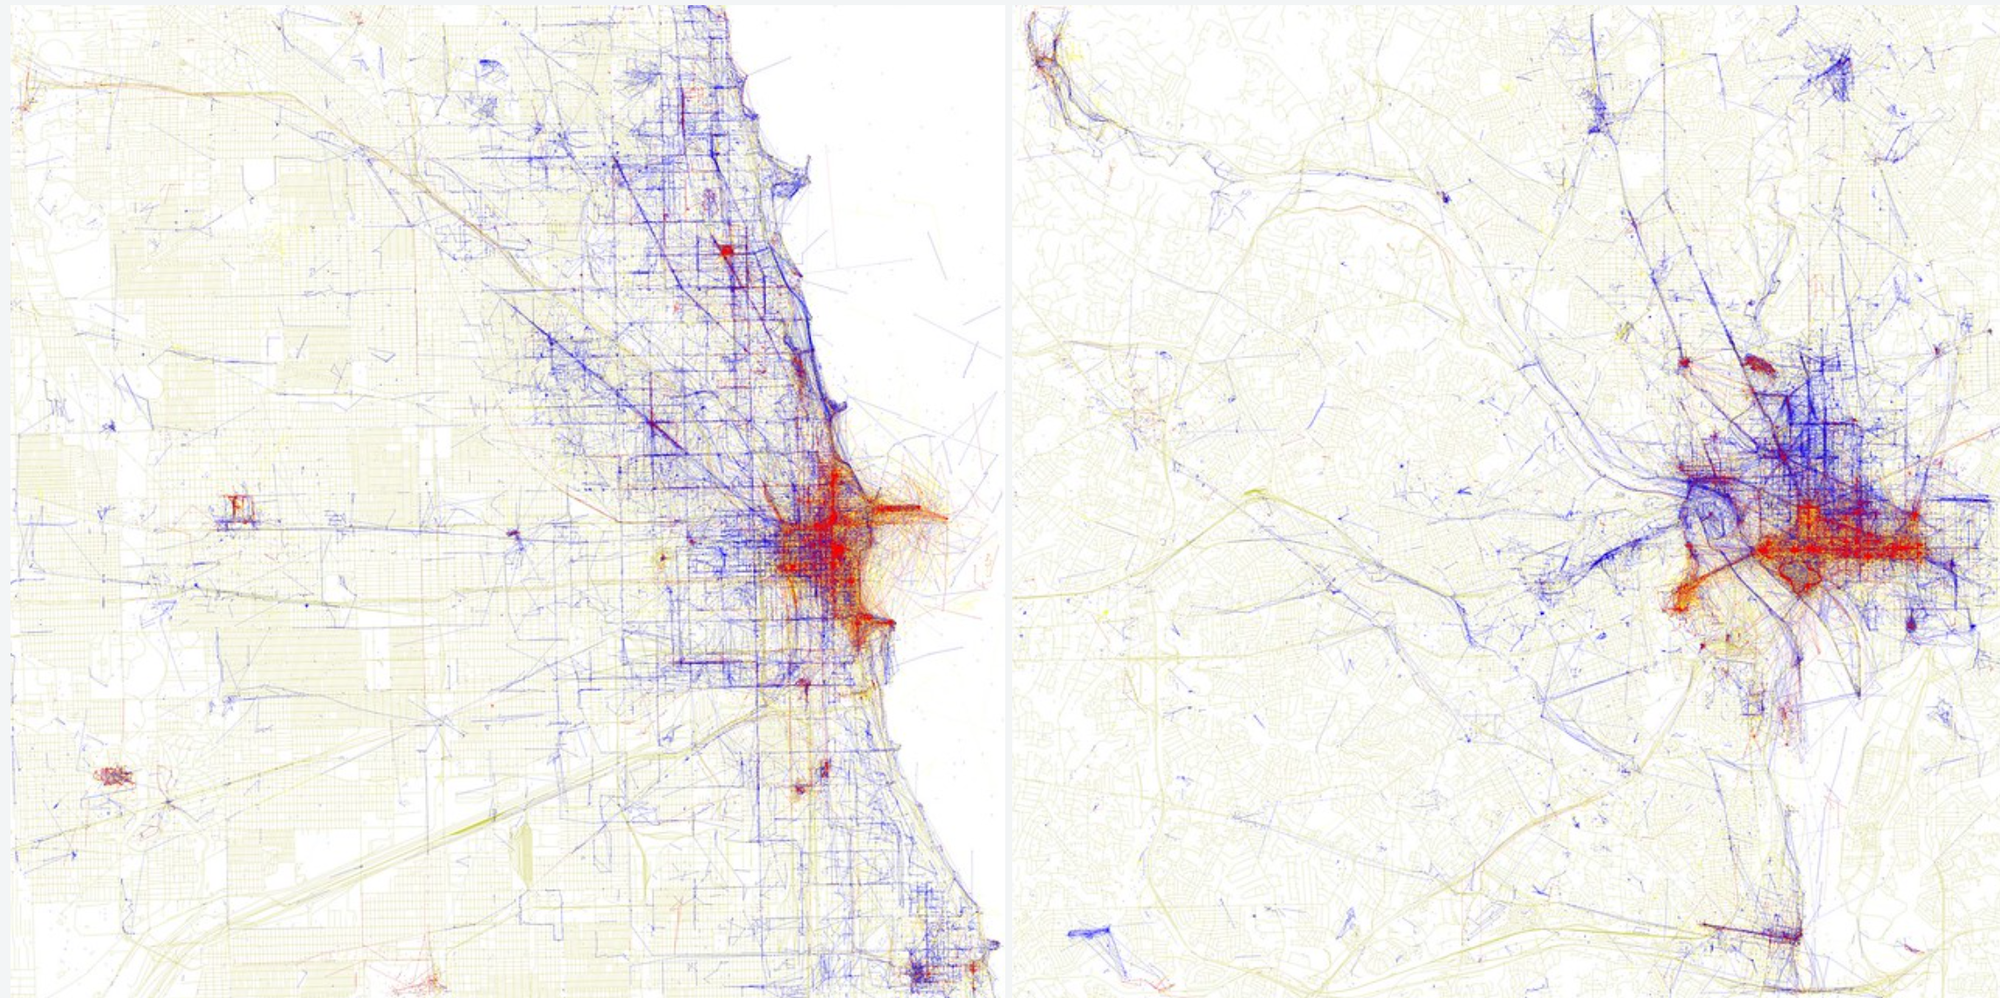
Elegant visualizations of cities by flickr geotags (divided into Locals and Tourists) : Eric Fischer
via flickr.com
A interesting updating of last year's project where Eric Fischer used geotags to create maps with visual densities of photo activity in big cities - this time he has sub-divided the activity into local (blue) and tourist (red) to evoke a fuller sense of how those groups see the cities.


Clever, interesting and beautiful. I don't know what Neville Brody's problem is.
From Eric Fischer:
"Some people interpreted the Geotaggers' World Atlas maps to be maps of tourism. This set is an attempt to figure out if that is really true. Some cities (for example Las Vegas and Venice) do seem to be photographed almost entirely by tourists. Others seem to have many pictures taken in piaces that tourists don't visit.
Blue points on the map are pictures taken by locals (people who have taken pictures in this city dated over a range of a month or more).
Red points are pictures taken by tourists (people who seem to be a local of a different city and who took pictures in this city for less than a month).
Yellow points are pictures where it can't be determined whether or not the photographer was a tourist (because they haven't taken pictures anywhere for over a month). They are probably tourists but might just not post many pictures at all.
The maps are ordered by the number of pictures taken by locals."
